

If the Internet were pop music, infographics would be The Beatles.
They’re irresistible. They create massive hits. At their best, they balance style and substance. They can be relentlessly imaginative. And like John, Paul, George and Ringo, they can communicate sophisticated ideas to a mass audience.
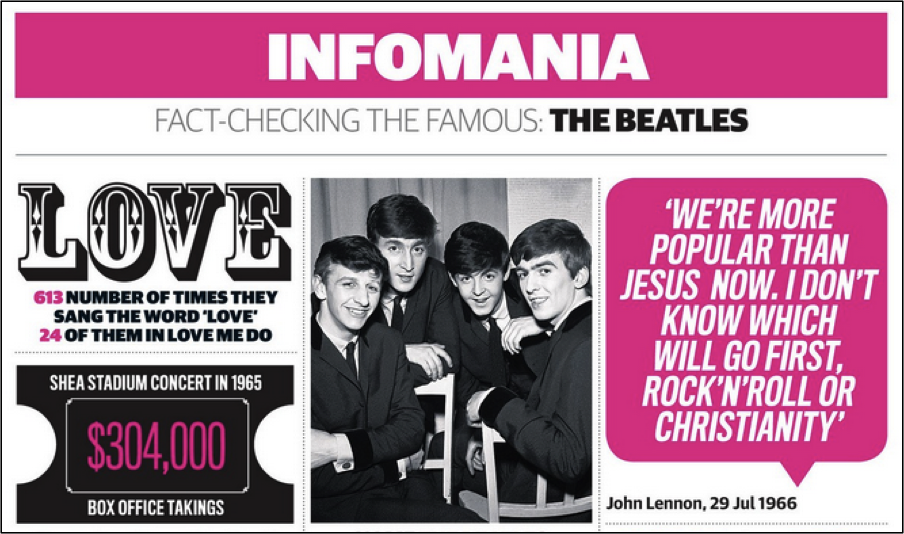
Yep, they’re lovable. How lovable?
This factoid comes from a 2012 infographic by NeoMam Studios. Infographics are so hot even stories about them sizzle. I wrote “The Most Important Thing You Need to Know About Infographics” and it climbed to the #1 spot on my chart last year.
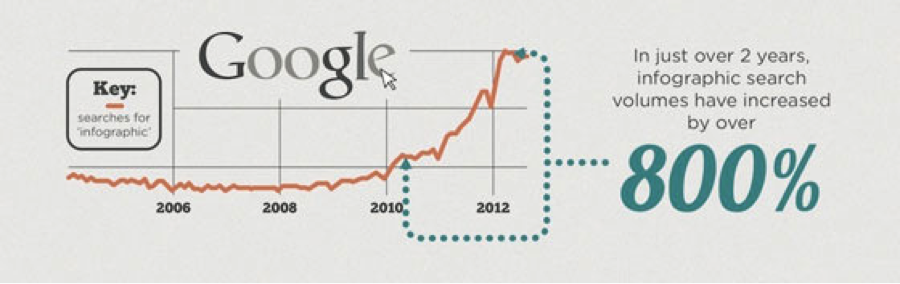
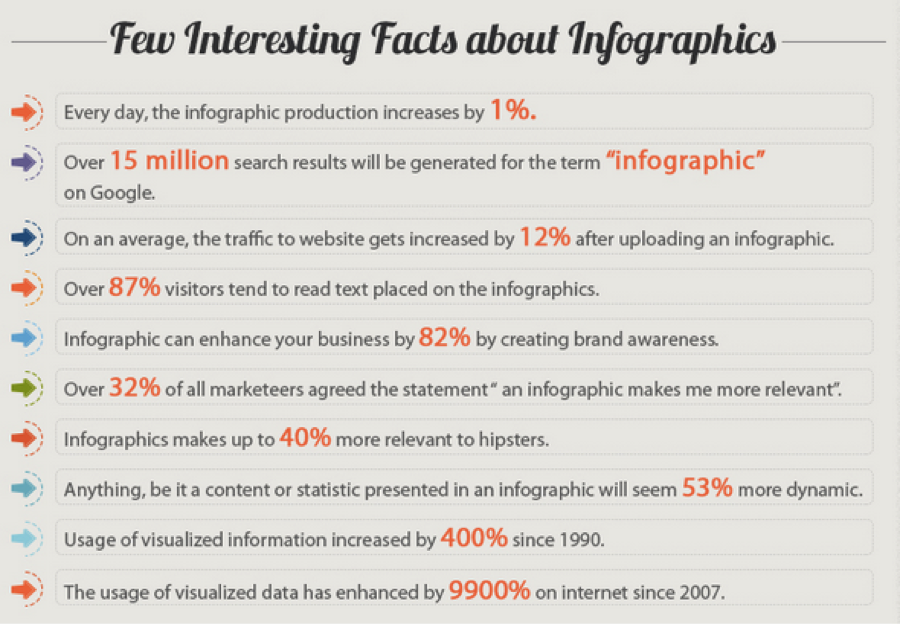
Granted, some of the nuggets from the infographic below (for which I can find no date) by Graphs.net register somewhere between fuzzy and freaky, but the first and final facts make a pretty strong case. Infographics are rocking it.
Why do we love infographics?
1. They’re so webable.
First, I must offer my theory and ask you to live with my funny new word. Where I’m going with this is I believe most of the stuff we love so much about life online—stories, pictures, interviews, video, conversation, reviews, etc.—didn’t get popular due to the web. We always loved them.
I submit though we may have come across data visualizations now and then in traditional media, they’ve exploded in the digital age because they are so perfectly suited for new media and the devices we use to consume information. I hope to make my case in the reasons that follow.
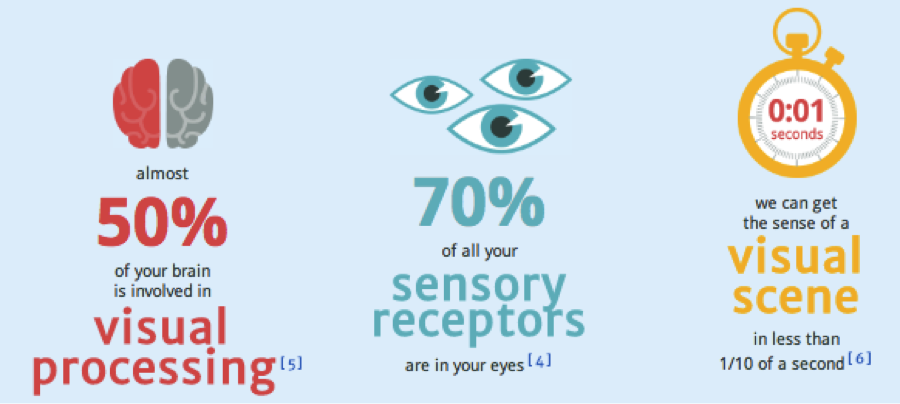
2. We’re visual creatures.
The fun interactive infographic, “13 Reasons Why Your Brain Craves Infographics,” makes this case with some powerful data points.
3. They simplify complex ideas.
Infographics aid comprehension. “Effects of text illustrations: A review of research,” from Educational Communication and Technology, explains people following directions with text and illustrations do 323% better than people following directions without illustrations. Simple, right?
4. They’re easy to share.
We love to share that which we value and feel others will too. It feeds our appetite for being conduits of wisdom. Infographics are ridiculously easy to share in the usual ways. Plus, the creators and publishers of infographics encourage you to share the content and often simplify the process by providing code you can embed on your website.
5. They’re familiar.
The general recipe for infographics features ingredients we’re comfortable with: illustrations, icons, charts, diagrams, captions. The familiarity speaks to us and obliterates any objections.,
6. They’re credible.
According to the Wharton School of Business, publishers of “Effectiveness of Visual Language,” 50% of the audience was persuaded by a purely verbal presentation, but 67% were persuaded by the presentation when it featured accompanying visuals. In my mind, from a user point of view, the persuasive power translates to the credibility we seek when consuming information.
7. They’re memorable.
A study by P.M. Lester in 2006, “Syntactic Theory of Visual Communication,” reports people remember 10% of what they hear, 20% of what they read, and 80% of what they see and do. Given I offer no visual to support this point, there’s a good chance you’ll soon forget it.
8. They travel well.
Infographics are multi-screen portable, break down nicely when presented as slides and tend to work on paper.
9. They’re fast.
Up above, in #2, you see an interesting data point about how fast we’re able to process visual information. The process of reading takes time. Given our short attention spans, the speed with which we can absorb visual information makes infographics attractive.
10. They’re less taxing.
A related, but slightly different idea than the one above about speed is we give ourselves a little break when we digest information aided by visuals.
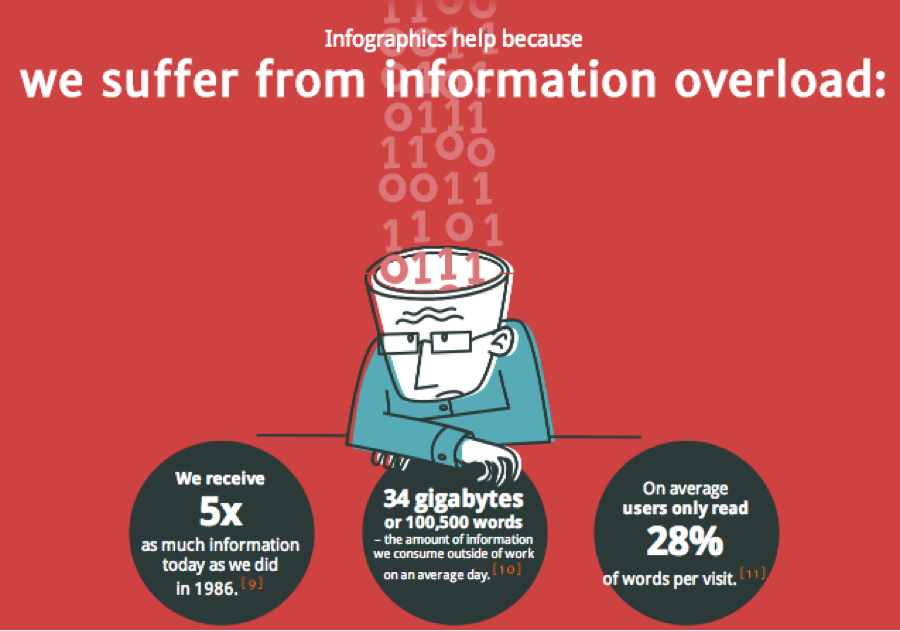
A lot of information’s coming at us. We can only read so much.
The data above comes from:
- Welcome to the information age – 174 newspapers a day, The Telegraph.
- Measuring Consumer Information, International Journal of Communication, Vol 6.
- How Little Do Users Read?
11. They give you ideas
I find infographics inspiring. I believe other writers and content creators in general discover concepts in infographics that are easily repurposed into a variety of media types.
12. People thrive on data
We’re drawn to data and the proof points it provides. A nice presentation I came across from Juice, Inc. explains data drives exploration, understanding, presentation, discovery, motivation, learning, and above all, “doing.”
13. They tell stories
A lot of infographics use storytelling tactics including characters and conflicts, problems and resolutions. We fall into stories as we relate to the characters and go on journeys with them.
14. They’re great for branding
It’s easy to steal written work, but much harder to swipe an infographic. Those that produce them, of course, want you to republish them. When you do, the brand travels with the graphic, usually including a logo and URL.
15. People search for them
Because they’re so useful (and often entertaining), people search for infographics, as evidenced in the statistic presented above. Those that create infographics often append their headlines with “[INFOGRAPHIC]” to help garner clicks.
16. People collect them
Do you do this? I sure do. When I find an infographic, I often suspect I’ll want to refer to it (or use it) again in the future, so I stash them for safekeeping on Pinterest and in my swipe files.
17. They dominate the page
I believe one of the many factors that make infographics attractive is they tend to dominate the page they’re presented on. They’re generally large and colorful, so unlike other forms of content, especially blog posts, they defeat the distractions the page may offer.
18. They’re so flexible
It seems to me just about any content or concept can become an infographic. They’re remarkably flexible. In the second half of this article, I’m going to share with you a long list of effective infographics ideas inspired by the many I’ve seen.
Want some ideas for making infographics?
You shall have them. Here are 25 effective infographics ideas, types, themes, and concepts.
- Process—Create an infographic to explain a process. They’re ideal for breaking down and simplifying a multi-step process that may otherwise appear intimidating.
- Comparison—There are so many ways you can pull-off this concept. To name a few: before and after, this vs. that; old way vs. new way; us and them
- Timeline—Infographics are immensely useful for pictorializing the evolution of practically anything.
- Roundup—Various types of roundups such as quotes, reviews, favorites, etc. can be presented as a collection.
- Parts of—Just as it’s useful to break a process down into pieces, you can decouple the parts of just about anything to aid understanding, say an engine, recipe, team, you name it.
- Instructions—Again, in the interest of simplifying complex tutorials, use an infographic to communicate the steps involved in completing a task.
- Charts and tables—Great infographics are often simply charts or tables, usually featuring icons or some type of images to create visual interest.
- Categories—Take any category of interest to your audience and tell a story with an infographic. Check out this amazing, no-frills graphic, which is a favorite of mine, “The Geneology of Pop/Rock Music.”
- Study of a “universe”—Again, you name it, beers, bands, books, bikes, beaches… Some epic infographics picture massive collections of some type of universe.
- Warnings—This popular style of article tends to be irresistible —a list of dangers, myths, mistakes, or some type of warnings—and has proven to be a powerhouse for infographics too.
- Metaphor—I love it when an interesting metaphor is chosen and developed to present a concept. I bet you do too.
- Resume—Job hunting? The resume as an infographic is such a compelling idea, services such as http://vizualize.me/, http://kinzaa.com/, and https://www.vizify.com/ (recently acquired by Yahoo!) have sprung forth.
- Report—Though it’s obvious there’s great value in being offered research and survey results in traditional report formats, the same information—or highlights from it—make for really cool infographics.
- Product or service—You may not score a viral hit with an infographic that showcases what you sell, but you’re likely to have an engaging tool for presenting your goods to potential buyers.
- Trend—Showcasing a trend in an infographic is a good way to make a newsworthy story even more fun.
- History of—This is another timeline idea that’s proven effective in so many categories.
- Place or event—Any place, from a nation to a campground—or any event, from a war to conference—lends itself to being summarized as an infographic.
- Guide—A rather obvious theme, I know, but a how-to of any kind begs to be simplified as an infographic.
- Family tree—These can be downright intoxicating. You can use a tree, flow chart, or similar metaphor to explain relationships.
- Cause & effect—You probably see these more than you realize, the “this caused that” form of presentation. It’s simple and smart.
- Biography—Do a search for “biography of Steve Jobs infographic” and you’re in for some amazingly creative graphics. Be inspired by them.
- Story—Simple one here. Tell a story, like a picture book.
- Manifesto—This approach can be a stellar branding tool. Write a manifesto to define what you stand for and hand it over to great designer to create an infographic you can be proud of.
- List—The age-old, can’t miss tactic for an infographic or any kind of content.
- Acronym—Spell out your acronym or abbreviation, with pictures, of course, and you’ll have a double whammy simplification of a robust idea.
How about one more for bonus points?
Consider creating infographics that showcase resources: books, blogs, etc. How about this? An infographic about infographics (coming soon).
Read more about this tasty topic:
http://www.creativebloq.com/graphic-design-tips/information-graphics-1232836
https://www.linkedin.com/today/post/article/20140515215103-4001334-why-do-infographics-work
http://unbounce.com/content-marketing/why-do-infographics-make-great-marketing-tools/
A version of this post was written for and published on Copyblogger.
![Multiplying the Effectiveness of Your Infographics [Infographic]](https://feldmancreative.com/wp-content/uploads/2019/07/Screen-Shot-2019-07-26-at-10.06.13-AM.png "Multiplying the Effectiveness of Your Infographics [Infographic]")
![The Secrets of Succesful Bloggers [Content Matters Episode 24] + INFOGRAPHIC](https://feldmancreative.com/wp-content/uploads/2017/03/Episode-24.jpg "The Secrets of Succesful Bloggers [Content Matters Episode 24] + INFOGRAPHIC")
![Free Online Design Tools for DIY Graphic Design [Infographic]](https://feldmancreative.com/wp-content/uploads/2016/08/free-online-design-tools.jpg "Free Online Design Tools for DIY Graphic Design [Infographic]")

Comments
Christopher J Curtis
Great article; thank you!
Matt Hayden
I love looking at and sharing infographics. But I’ve never really wanted to create one myself. Maybe that’s a bit weird, I’m not sure …
In the end I think I just prefer to express myself through good ol’ fashioned writing!
EYEWEARINSIGHT
Very nice, thank you…learned quite a bit here.
EYEWEARINSIGHT
http://insightvision.eyewearinsight.com/category/more-about-glasses/#gs.bbe02d5c4e65407ba70eaf8f8ff18773
Wonder if you have a minute to critic this one.
Barry Feldman
It’s essentially a brochure—not even a good one. It’s not helpful, so while it may be of interest to your customers, it won’t give you the traditional benefits of a great infographic because it won’t be shared.
I’ll leave this comment here because we’re at least on topic, but a blog comment stream is hardly the right place to ask for a free consultation.
I recommend you adjust your approach to social media.
[image: photo]
*Barry Feldman | Feldman Creative*
Online marketing super freak
p:916.984.9988 | m:408.489.1029 | e:barry@feldmancreative.com | w: http://www.feldmancreative.com
The Point – Feldman Creative Blog 100 Ways Your Company Loses to Better Online Marketers
Get a signature like this: Click
here!
SEO
You have made some good ideas there. This is a great post about some of the Infographics, So thanks for sharing it.